Interactive Graph Visualization in Jupyter with ipycytoscape
The Jupyter widgets ecosystem offers a broad variety of data visualization tools for exploratory analysis in the notebook. However, we lack a good story for exploratory graph visualization.
Cytoscape is an open-source software platform for visualizing complex networks and integrating these with any type of attribute data. While it comes from the computational biology community, cytoscape is fully-fledged general-purpose tool for graph visualization and analytics. It now includes a modern web front-end (Cytoscape.JS) which is a great candidate for integration with Project Jupyter. This is the raison d’être of ipycytoscape.
The goal of ipycytoscape is to enable users of well-established libraries of the Python ecosystem like Pandas, NetworkX, and NumPy, to visualize their graph data in the Jupyter notebook, and enable them modify the visual outcome programmatically or graphically with a simple API and user interface.
Fortunately, Cytoscape offers a broad enough API that allows ipycytoscape to be a tool that can, in fact, be used to solve any type of problem modeled as a graph. Some examples consist in the development of new chemicals to analyze interactions between substances in the pharmaceutic industry, in security systems to create attack graphs that can be useful to show possible vulnerabilities in systems, modeling human behavior to understand people’s interaction with business or even to understand complex phenomena like the current crisis. Currently, there is an effort to make ipycytoscape an accessible tool for researchers that are trying to find ways to mitigate and understand it, there is more information about this initiative on the COVID OSS Help website and the discussion is happening in this repository if you're interested in joining it.
Current state
IPycytoscape is part of the PLASMA project (aka in French, Plateforme d'eLearning pour l'Analyse de données Scientifiques MAssives). This project aims at creating an interactive tool to teach computational analysis of massive scientific data. Its first instance, PlasmaBio, is designed for the needs of teachers and students of the European Master of Genetics at Université de Paris. PlasmaBio provides an authentic experience of the actual genomic and bioinformatic analyses performed in research labs. For that purpose, a custom JupyterHub-based system to control many different Jupyter instances is being specially developed by Jeremy Tuloup at QuantStack.
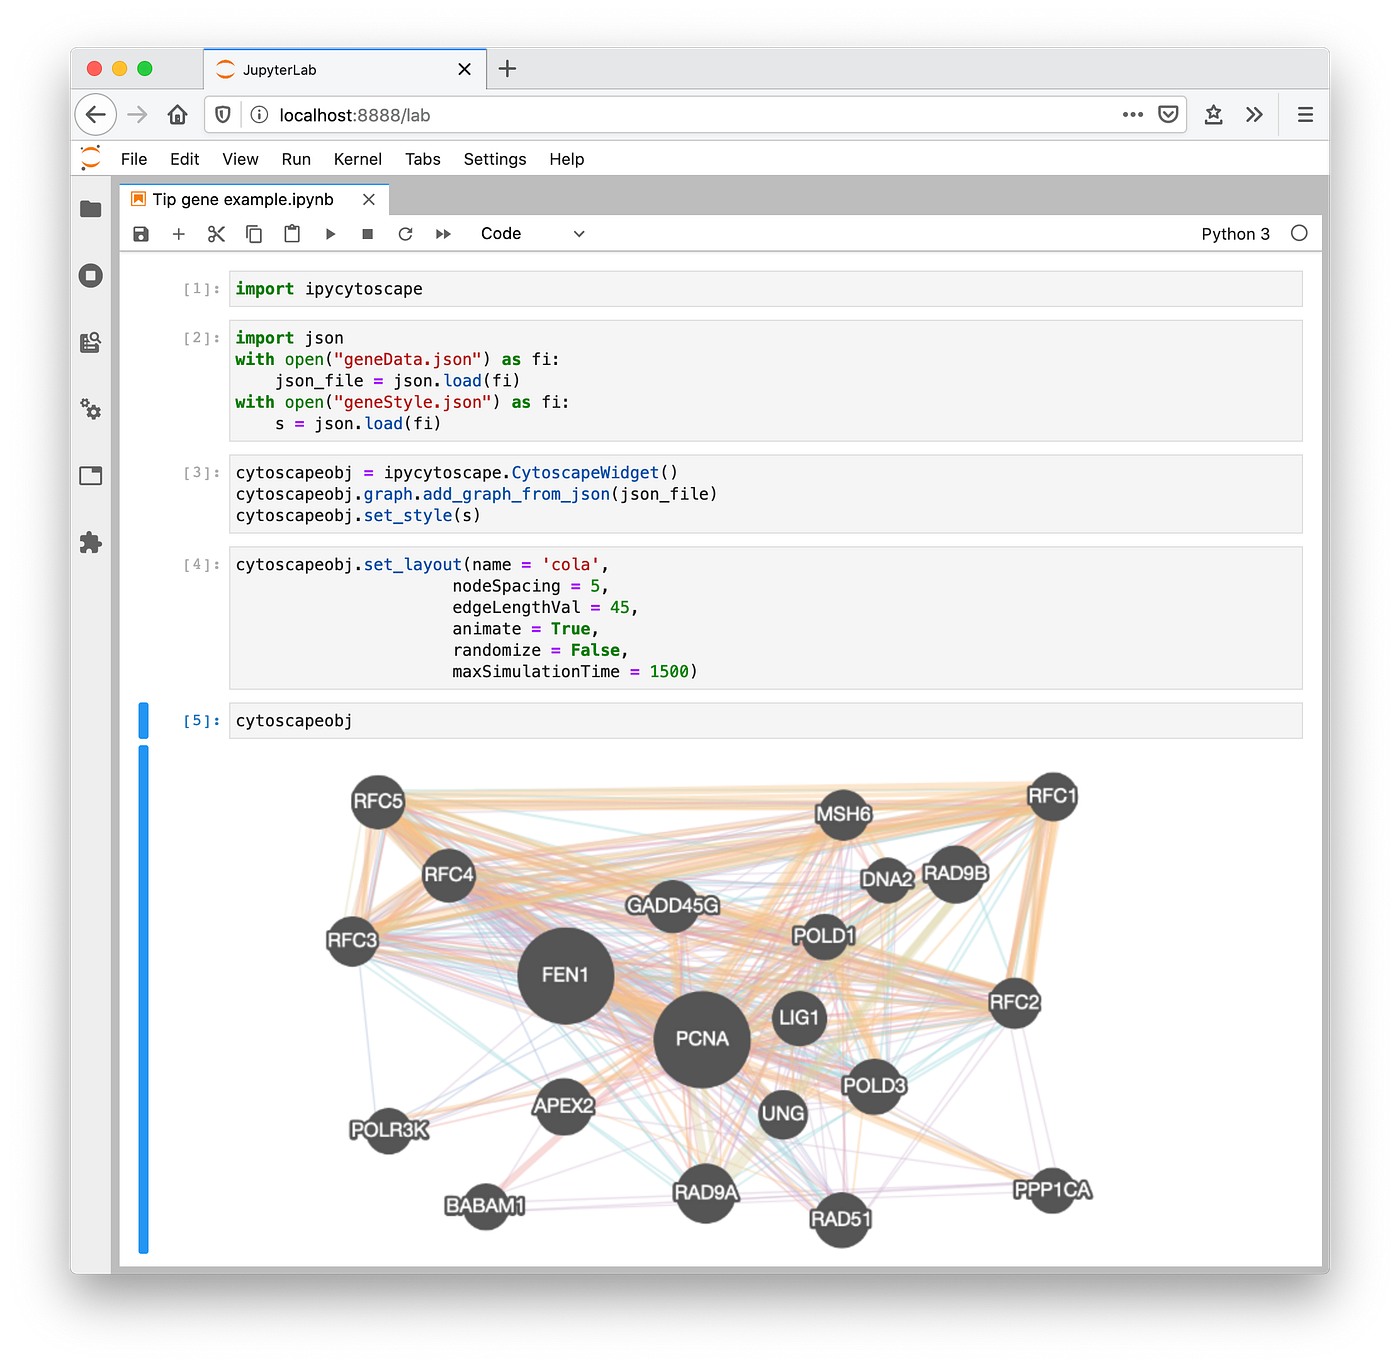
In this first version of ipycytoscape, there are still some limitations to what you may be able to do, but there are also some extents from the Python world that will just work out of the box for you. ipycytoscape offers integration between Pandas DataFrames and NetworkX, meaning that you can have a graph visualization of the data you already have with minimal or none adjustments and just a few lines of code.

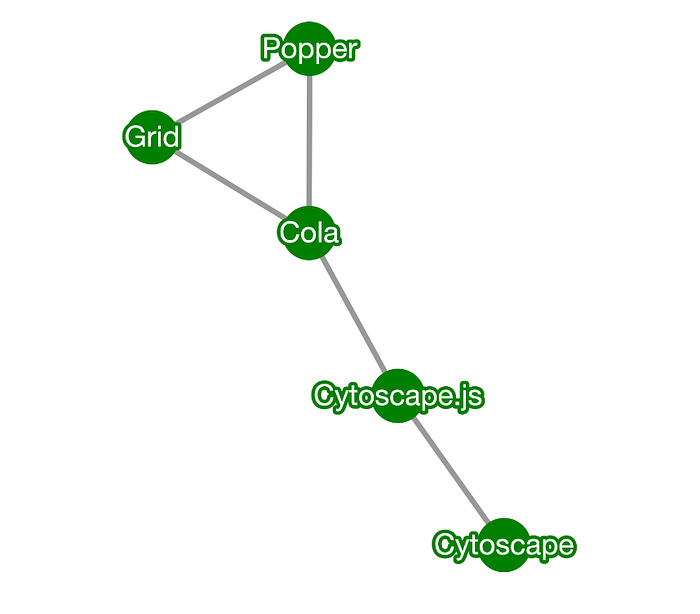
ipycytoscape supports all of the built-in CytoscapeJS layouts. This includes the cola, grid, breadthfirst, circular, concentric and Dagre layout as well as the random, null or preset options to build a graph visualization that fits better to your data .Additionally, ipycytoscape also supports the PopperJS and TippyJS extensions, that allows you to create customizable tips for your nodes and edges .

You can also use a variety of labels for a quick visualization of your nodes’ and edges’ contents.
Like most Jupyter interactive widgets, ipycytoscape relies on the traitlets library to synchronize data between the back-end and the front-end model.
Unfortunately, traitlets have a limitation when it comes to container objects and other mutable structures, because synchronization is only triggered upon assignment of the container and not when modifying individual elements.
To work around this limitation, we make use of the excellent Spectate library by Ryan Morshead, which triggers observers upon individual element changes in containers.
Try it online!
You can try it without the need of installing anything on your computer just by clicking on the image below:

Installation
Note that you first need to have Jupyter installed on your computer. You can install ipycytoscape using pip:
pip install ipycytoscapeOr using conda:
conda install -c conda-forge ipycytoscapeIf you use JupyterLab, you would need to install the JupyterLab extension for ipycanvas (this requires nodejs to be installed):
jupyter labextension install @jupyter-widgets/jupyterlab-manager jupyter-cytoscapeAbout the author

My name is Mariana Meireles and I’m a software developer working for QuantStack. I care deeply about the impacts that technology has in the world and try my best to be the change I want to see by contributing to open source projects that stand upon libre and diverse standards.
Prior to QuantStack I worked as a developer on the PySide team at the Qt Company and as a web performance developer at Mozilla.
Currently I’m working on expanding the Jupyter ecosystem with new libraries and functionalities, like an experimental SQLite kernel.
Acknowledgements
The development of ipycytoscape at QuantStack was funded as part of the PLASMA project, led by Claire Vandiedonck, Pierre Poulain, and Sandrine Caburet, associate professors at Université de Paris.
Sponsors to the PLASMA initiative include:
- Région Île-de-France, via the “Trophées franciliens de l’innovation numérique dans le supérieur” (EdTech 2018) grant program,
- Université de Paris, via the Initiative of Excellence (IdEx) Label and its "inovating teaching" grant program,
- EUR G.E.N.E., the graduate school on Genetics and Epigenetics,
- the university training "Création, analyse et valorisation de données biologiques omiques" (DU Omiques).