Interpreted C++ for GIS with Jupyter

The recent release of the Jupyter kernel for C++, based on the Cling interpreter enabled a number of new workflows for the users of the C++ programming language.

Features of the xeus-cling C++ kernel for Project Jupyter include:
- Showing quick-help pages for functions and classes of the STL and user-defined types, by prefixing them with a question mark:
For example, typing?std::vectorresults in a pager displaying the page from cppreference onstd::vector.

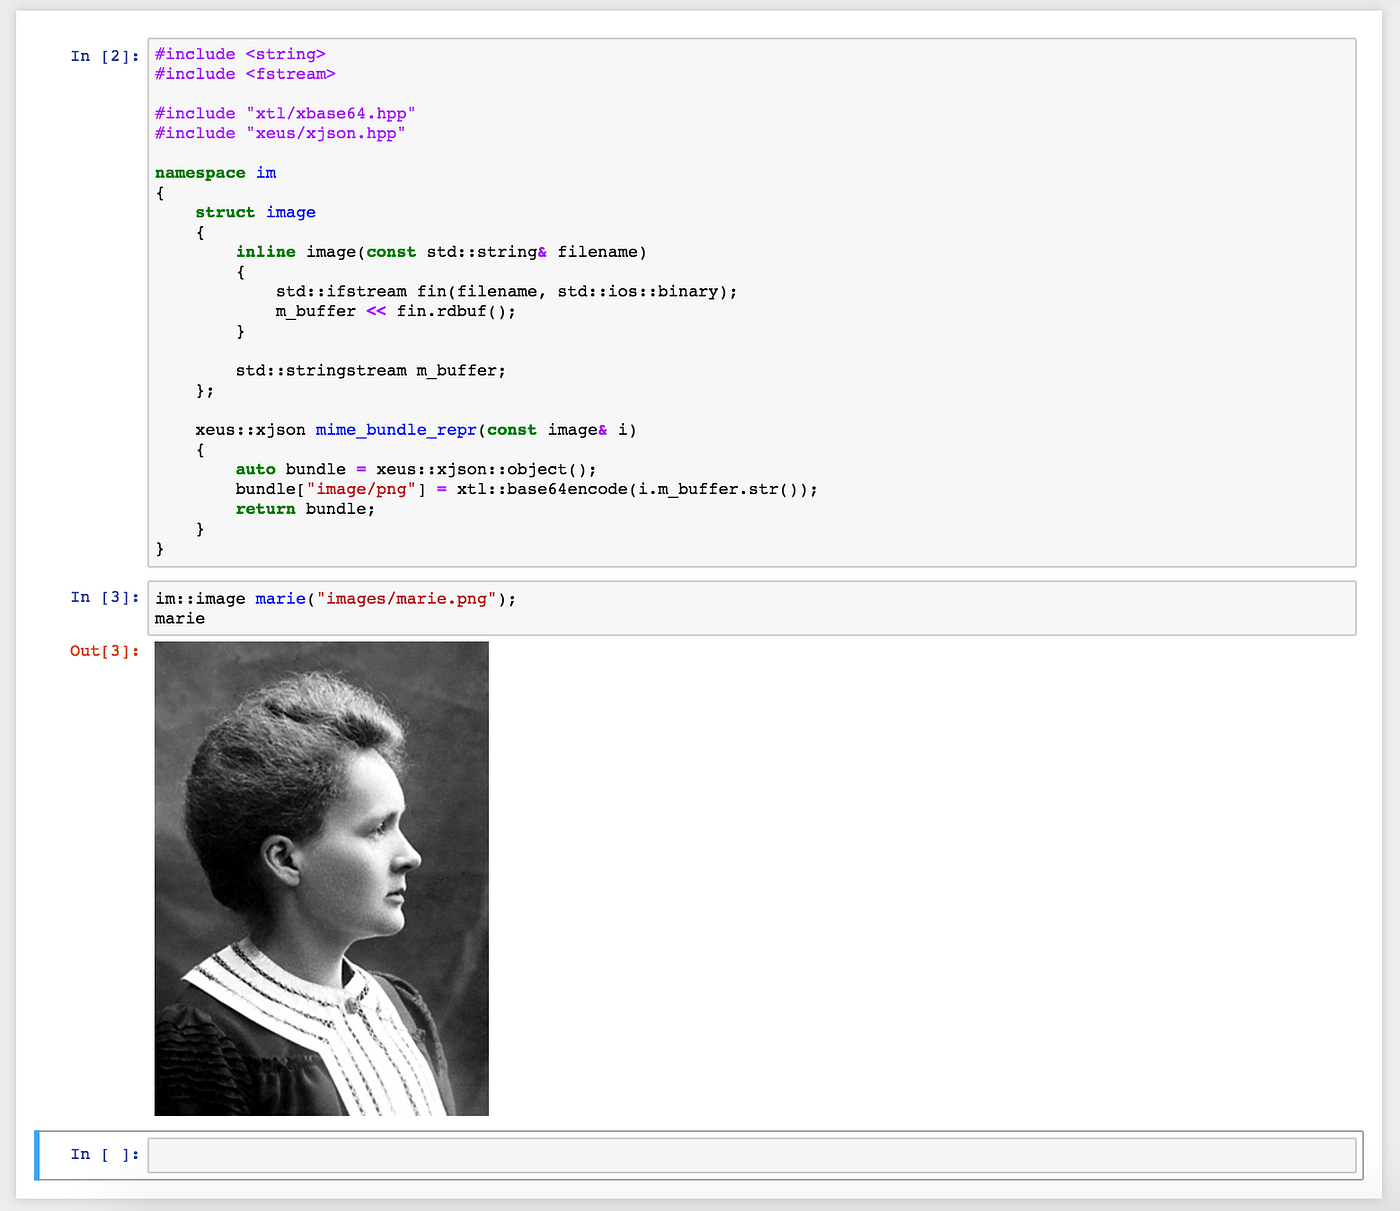
- Making use of the rich display features of the Jupyter stack, for user-defined types.
This can be enabled simply by overloadingmime_bundle_reprin the namespace of the class for which we wish to have a rich representation in the front-end. The overload is picked up by the display system through argument-dependent lookup (ADL).
- Another aspect of the newly released C++ kernel is the implementation of the Jupyter widgets protocol, enabling bi-directional communication between the front-end and the kernel.
The xwidgets package, built upon xeus provides a complete implementation of the protocol, together with the implementation of most of the controls available in the reference ipywidgets Python package.

More than a limited set of base controls, Jupyter widgets are a framework upon which one can build arbitrarily complex interactions. A large number of interactive widget libraries has been built upon ipywidgets. Popular examples include pythreejs (a Jupyter-threejs bridge), bqplot (an interactive plotting library for Jupyter), and ipyleaflet (a Jupyter-leafletjs bridge) allowing rich interactive maps in the Jupyter notebook.
A common trait of most of these packages is that most of the logic is implemented in the front-end, while the back-end only involves synchronization of data attributes.
A fully-specified communication protocol and a thin back-end architecture facilitate the job of kernel authors willing to bring the power of these visualization libraries to their language of choice.
Hence, we have taken on the endeavor of providing a C++ implementation of the most popular Jupyter interactive widget libraries. These packages can be used in the C++ kernel, as well as in compiled application making use of the Jupyter kernel protocol.

Today, we are proud to announce the first release of xleaflet, the C++ counterpart to the popular ipyleaflet package, and which makes use of the same front-end component.
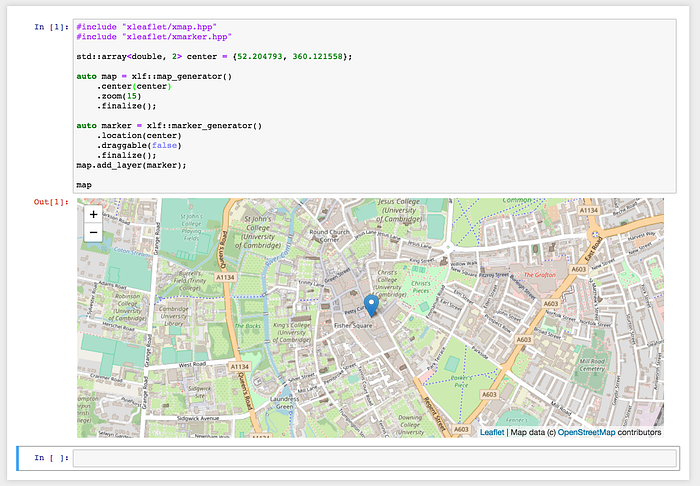
You can get started by simply creating a map inline in the Jupyter notebook.
- Specifying a center location and zoom level
- Specifying the tile layers to be displayed among the predefined base maps

A number of other attributes can be set in the map widget. To mimic named parameters, all widgets of xwidgets and xleaflet are provided with a generator class which can be used to initialize attributes using method-chaining syntax.
In addition to the base map feature, a broad number of features of the leaflet JavaScript library are exposed to the C++ backend directly. This includes markers, marker clusters, image overlays, a variety of controls.
Whenever an attribute of a widget is modified in the front-end or in the back-end, the other side will properly reflect the data change.
For example, setting marker.location to a new value in the previous example will actually move the marker on the map. Reversely, if the draggable attribute was set to true, whenever the marker position changes in the front-end, the value is reflected in the C++ model.
Another example is the support of the GeoJSON format, which allows one to load a JSON file locally and display its content on the map.
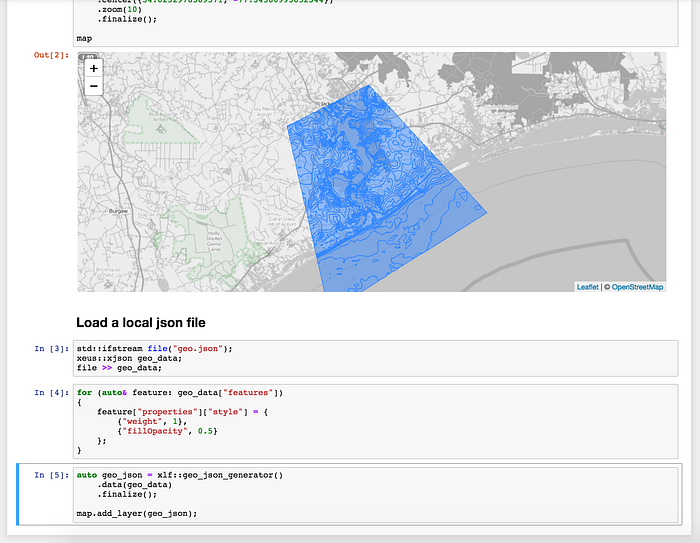
The bidirectional communication between the front-end and the C++ back-end makes it easier for the end user to create interactive web applications without having to write any JavaScript.
Using the rich features of xleaflet, one can start building fully-fledged GIS application in C++.

If you are interested in trying xleaflet right now in your web browser, we provided a binder for you.
Simply click on the following binder link and start playing with interactive GIS in C++ in your web browser:

Check out the documentation for more detailed information about xleaflet.
Aknowledgements
The software presented in this post was built upon the work of a large number of people including the Jupyter team, the Cling developers, the developers of xeus and xwidgets, and the developers of leafletjs.
We are especially grateful to Sylvain Corlay, Loic Gouarin, Johan Mabille, and Wolf Vollprecht.
The development of xeus, xwidgets and related packages at QuantStack is sponsored by Bloomberg.
About the Author
Martin Renou is a Scientific Software developer at QuantStack. Prior to joining QuantStack, Martin studied at the French Institute of Aeronautics and Space. As an open source developer, he worked on a variety of projects, notably SciviJS, a JavaScript library for 3-D mesh visualization.

