ipygany: Jupyter into the third dimension
Scientific visualization in the Jupyter notebook
From Paraview to Mayavi, there are multiple solutions for data analysis on 3D meshes on the desktop. Most of these tools provide high-level APIs that can be driven with a scripting language like Python. For example, one could control Paraview from a Jupyter Notebook. But this is not ideal as it relies on a desktop application for the rendering, which prevents using tools like MyBinder.
Nowadays, most scientists run their computation on the cloud, and they need tools for interacting and analyzing with their data.
There are already some solutions that are more integrated into Jupyter:
- ipyvolume is a WebGL-based 3D plotting library for Jupyter. It has many features including multi-volume rendering.
- K3D-jupyter helps you create 3D plots backed by WebGL with high-level API (surfaces, isosurfaces, voxels, mesh, cloud points, vtk objects, volume renderer, colormaps, etc).
- itkwidgets is a tool for visualizing images, point sets, and meshes in 2D and 3D in Jupyter. It works by doing the rendering on the back-end and by streaming the frames to the front-end.
- ipyvtk-simple is a Jupyter library for interfacing with any Python vtkRenderWindow. It relies on ipycanvas for streaming the frames to the front-end.
We needed a Paraview-like experience for Jupyter. We could provide this experience by relying on the vtk library in Python, but this means that every time you want to apply a new filter like warp-by-scalar, the Python back-end needs to send the filtered mesh to the front-end for display. This is far from ideal, as it might be hundreds of megabytes to download for every roundtrip to the back-end.
itkwidgets and ipyvtk-simple fix this issue by not sending the mesh to the page, instead, the rendering is done on the back-end and streamed to the user. This solution is, in a way, similar to using Paraview using a vnc solution. It works fine as long as you have a fast and low latency connection to the Jupyter server, and this solution scales properly with the mesh size, as the amount of data sent to the user is the same whether you analyze a fine or a coarse mesh.
Solutions like ipyvolume and K3D-jupyter can be backed by the Python vtk library (or by PyVista), but again, this means doing the mesh filtering in Python and sending the filtered meshes to the page for every change.
Today we are proud to announce ipygany! ipygany is a Jupyter widget that aims at bringing a Paraview-like experience to the webpage. With ipygany, you only send your mesh data to the front-end once, and effects such as mesh warping, contour computation, threshold filtering are directly done in the front-end and most-typically with the GPU.
Introducing ipygany
ipygany is a new interactive widgets library that allows you to visualize and analyze volumetric data in the Jupyter Notebook.
Whether your data comes from a VTK file or NumPy arrays, ipygany allows you to dynamically load your data, display them in the Notebook, and apply different kinds of visual effects on it.
ipygany provides a set of effects inspired by Paraview:
- IsoColor: apply color-mapping to your mesh.
- Warp: deform your mesh given a 3-D input data (e.g. displacement data on a beam)
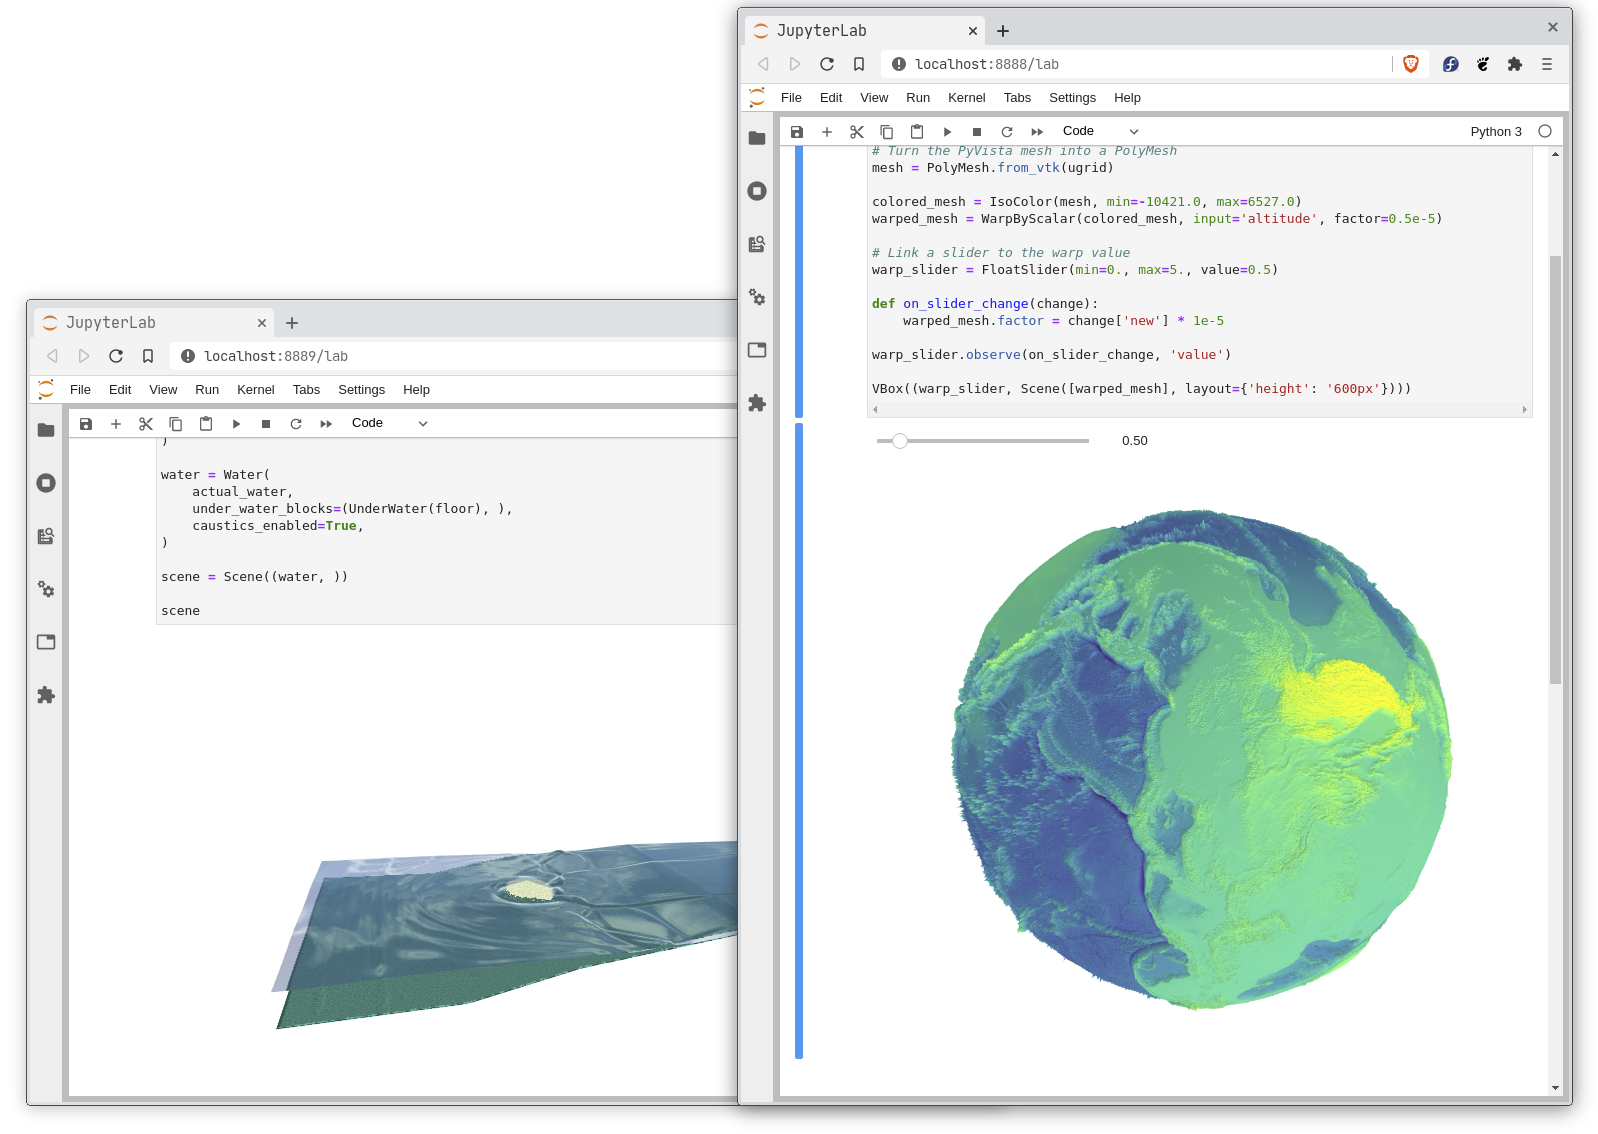
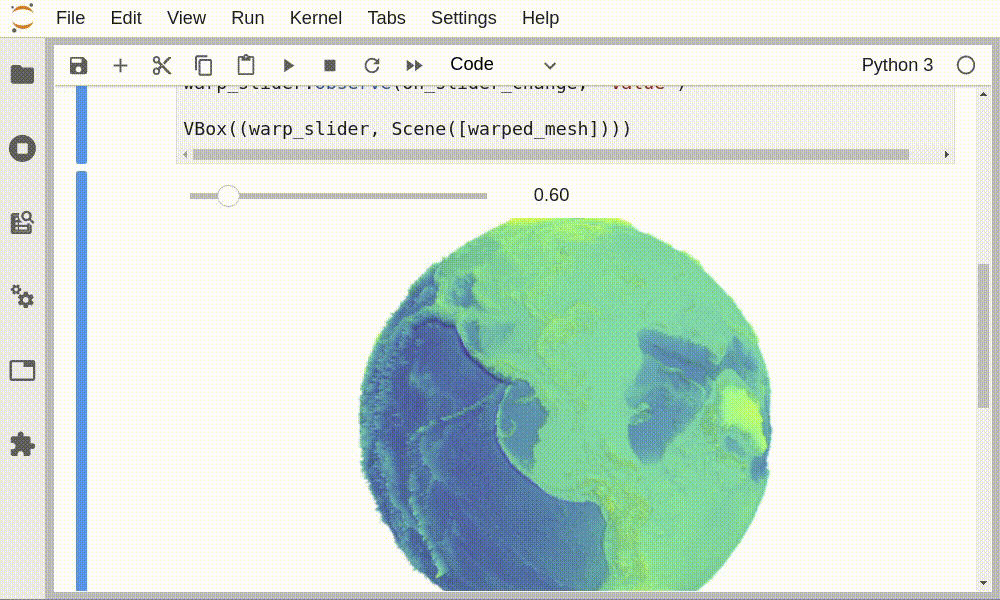
- WarpByScalar: deform your mesh given a 1-D input data (e.g. terrain elevation)
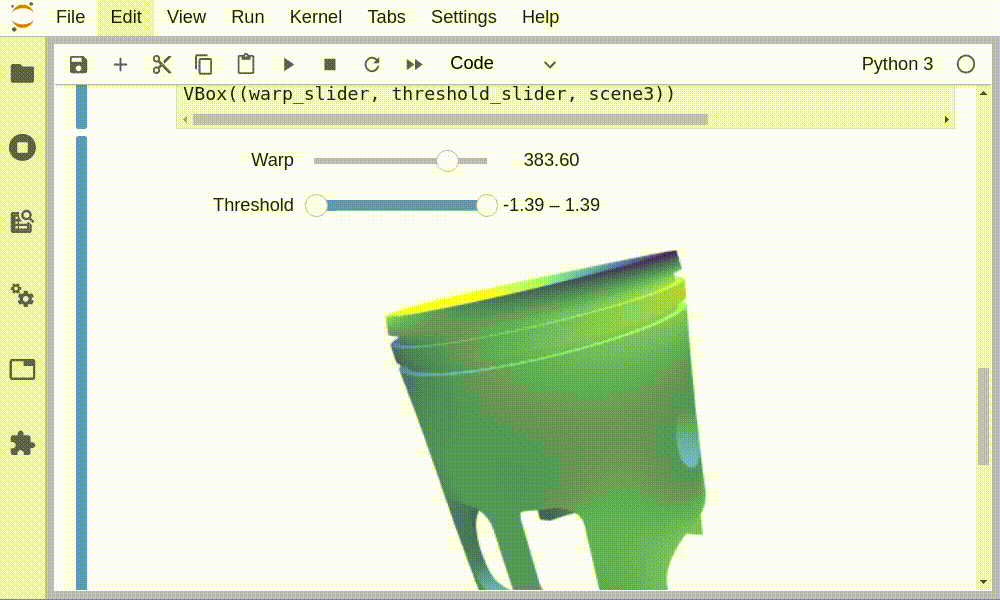
- Threshold: only visualize mesh parts inside a range of data (e.g. 222 K≤ temperature ≤ 240 K)
- IsoSurface: only visualize the surface where the mesh respects a data value (e.g. pressure == 3 bar)
- Glyph effects like PointCloud
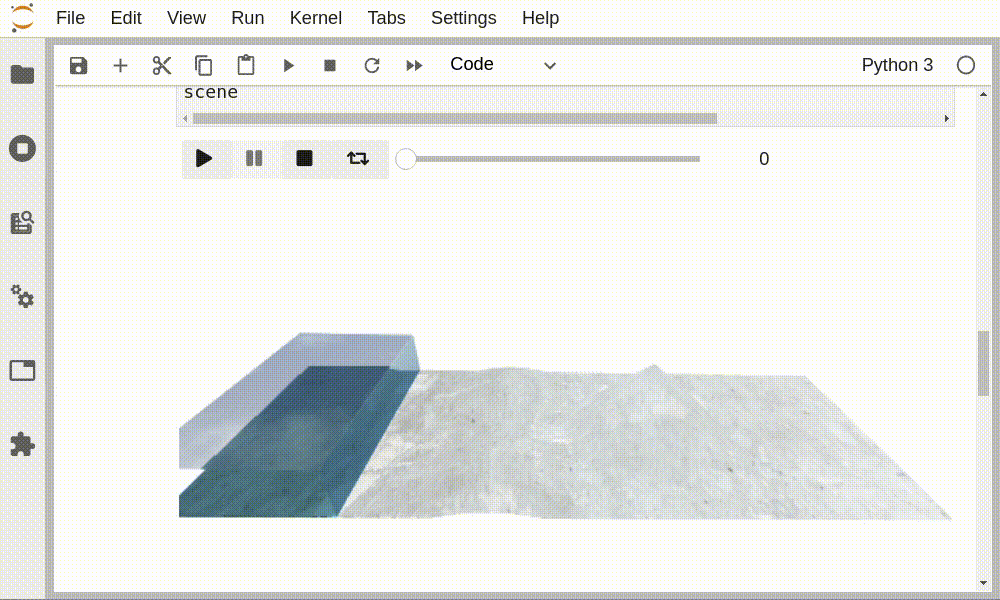
- Water visualization
- And there’s more to come!
Most of those effects are computed on the GPU only! Which makes them really fast. For example, changing the deformation factor of the Warp effect only sends one floating-point number to the GPU, and the GPU will know how to re-render the mesh (using shaders) according to the new factor value, this update is virtually instantaneous. Changing the warp factor value is technically as fast as moving the camera position, it only requires rendering a new frame.
We strive to use efficient algorithms for better performances, especially for computation that cannot be done with the GPU.
Effects can be easily combined for highlighting important parts in your mesh. For example, you can easily cut your mesh using the Threshold effect then apply a Warp effect for visualizing a deformation on the result.
All those effects are interactive widgets, they are stateful objects that you can dynamically update from Python or using widgets like sliders, text inputs, etc.
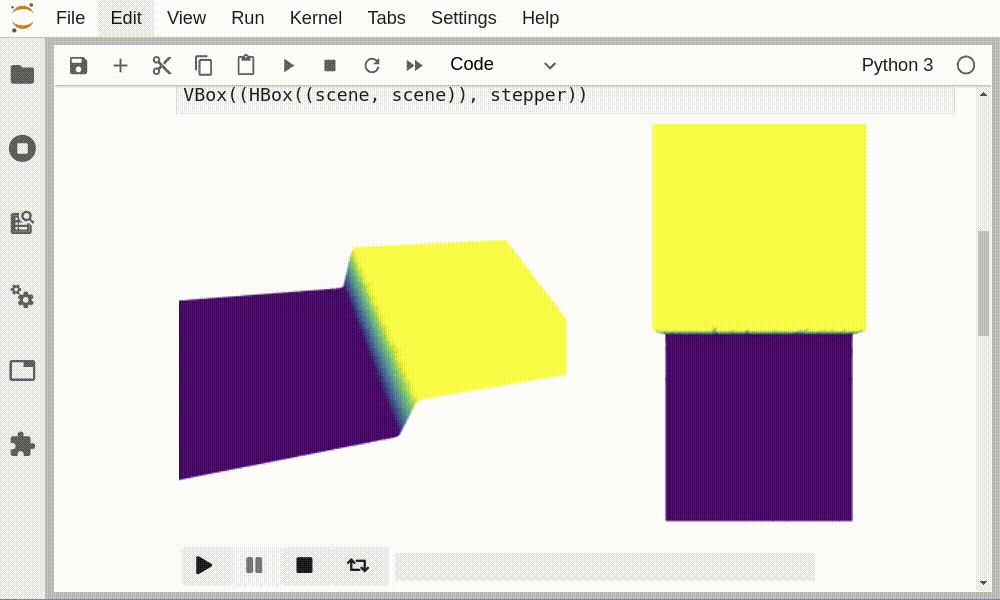
Your mesh is also an interactive widget: you can dynamically update your data, which is very useful when your data changes through time.
If you work with fluid dynamics, we even provide refractive/reflective effects and water caustics computation for nice looking visualization:
Installation
You can install ipygany with conda or mamba:
mamba install -c conda-forge ipyganyOr
conda install -c conda-forge ipyganyOr you can install it with pip:
pip install ipyganyIf you use JupyterLab you’ll need to install the labextension (not needed with the coming JupyterLab v3):
jupyter labextension install @jupyter-widgets/jupyterlab-manager ipyganyDocumentation
You can find the documentation following this link:
https://ipygany.readthedocs.io
Try it online
Thanks to MyBinder, you can try it out without the need of installing anything on your computer. Just follow this link:

Acknowledgement
This work is led at QuantStack and founded by ERDC.
About the Author

My name is Martin Renou, I am a Scientific Software Engineer at QuantStack. Before joining QuantStack, I studied at the aerospace engineering school SUPAERO in Toulouse, France. I also worked at Logilab in Paris, France and Enthought in Cambridge, UK. As an open-source developer at QuantStack, I work on a variety of projects, from xtensor and xeus-python in C++ to ipyleaflet and bqplot in Python and Javascript/TypeScript.

