Meet Xeus-R: a future-proof Jupyter kernel for R
The Jupyter ecosystem provides a versatile and user-friendly platform for data analysis and scientific computing, it has democratised access to powerful tools for researchers, scientists, educators, and data professionals.
The name Jupyter, a blend of Julia, Python, and R has always hinted at its relevance in multiple scientific programming languages and has since conquered new horizons thanks to its flexible and extensible design.
Underneath the interactive surface of Jupyter lie the Jupyter kernels, a set of language specific engines orchestrating the dynamic execution and exploration of code. Kernels implement the Jupyter protocol, a shared specification of the communication process between notebooks and kernels, defining how messages, commands and outputs are exchanged and processed.
The Xeus framework is a central piece of the puzzle, offering a reference to facilitate Jupyter kernel implementations. The speed, extensibility, and alignment with the official protocol make Xeus a perfect technology to implement new kernels.
Xeus-R
Today, we, a collaborative team led by Romain François and supported by QuantStack, are thrilled to announce the initial release of Xeus-R, a future-proof Jupyter kernel for R. Xeus-R builds upon the components of Xeus to facilitate the use of R in Jupyter notebooks and already supports typical capabilities: R code execution, inspection, completion, and contextual help.
The recent advancements in support for WebAssembly in the R world led by the WebR project, the flexible design of Xeus, and the rise of JupyterLite all contribute to our strong belief that Xeus-R has the potential to deliver Jupyter in-browser experience for data scientists using R.
Xeus-R is currently at the stage of a proof of concept, but we wanted to communicate about it early to broadcast our excitement about its potential, share some of our thoughts, and initiate a conversation.
Relationship with IRkernel
While the IRkernel project paved the way and is the current reference implementation of a Jupyter kernel for R, it does not take advantage of the Xeus infrastructure and includes a complete implementation of the Jupyter protocol, down to the composition of all of the JSON messages and most importantly how they are transported through ZeroMQ sockets.
In contrast, Xeus-R fully embraces and leverages the capabilities of Xeus, while borrowing some higher level concepts from IRkernel and reusing features from its dependent packages IRdisplay and repr.
We believe this path will benefit future development as it gives us the freedom to work on innovations that are specific to the needs of R users, and let Xeus absorb evolutions of the Jupyter protocol.
Key features
Xeus-R implements the basic building blocks of what you would expect from a Jupyter kernel. The results of a code cell, i.e. the value of its last expression are displayed in the output, taking advantage of ANSI escape codes for colours as were made popular by the crayon and later cli R packages.
![Screenshot of a Jupyter notebook with 3 cells visible. The first cell [2] contains a line of R code that uses cat and glue to print “hello world” with “world” coloured in green thanks the col_green function from the cli package. The second cell [3] shows the command head(mtcars) which outputs a plain text version of the first 6 rows of the mtcars data frame. The third cell [9] contains R code that loads the tibble package and then prints mtcars as a tibble, therefore benefitting from formatting.](https://miro.medium.com/v2/resize:fit:1400/1*XznRckf13HpNy_S7h7-_iA.png)
Traditional and ggplot2-powered graphics are captured and displayed as images. The aspect ratio of plots can be controlled by setting the repr.plot.height and repr.plot.width options either globally, or locally via the cell_options() function.
![A Jupyter notebook cell [13] with R code and its output. The code sets options locally with the cell_options() function and then creates a box plot with the following code: boxplot(decrease ~ treatment, data = OrchardSprays, col = “bisque”, log = “y”). The output is a a graphic with 8 boxplots, representing the treatment factor and its levels A to H on the x axis, and the variable decrease on the y axis, with a logarithmic scale.](https://miro.medium.com/v2/resize:fit:1400/1*oi1bSbjYZg_I_H104v-75g.png)
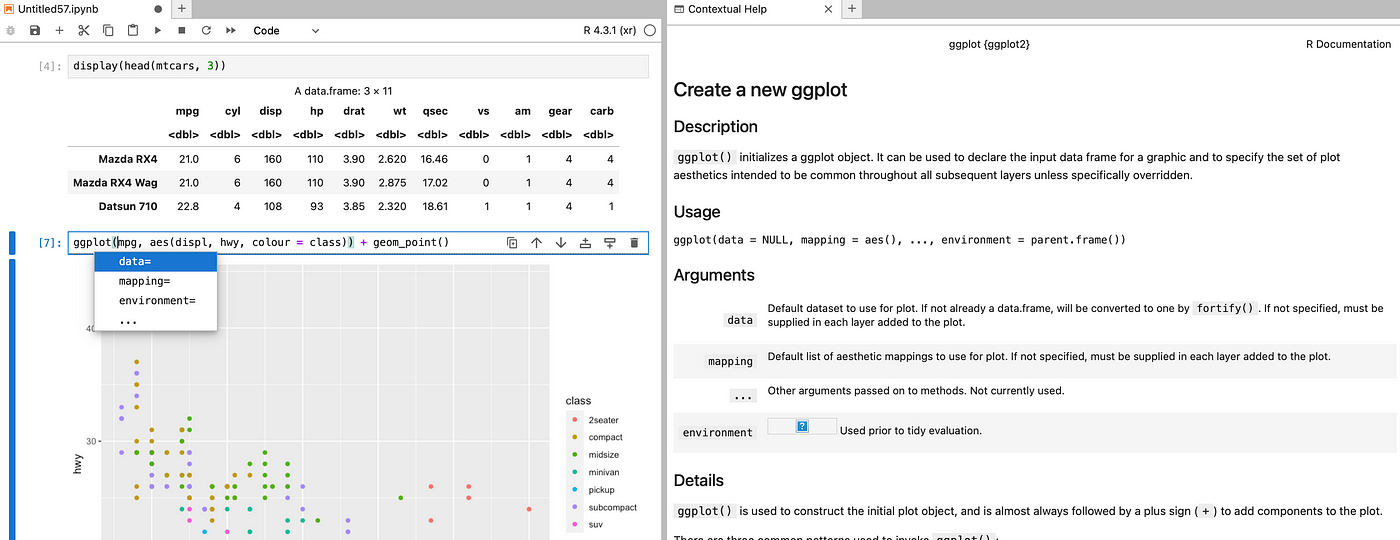
![Screenshot of a Jupyter notebook cell [15] with R code and output. The code is loading the ggplot2 package and then creating a scatterplot with the following code: ggplot(mpg, aes(displ, hwy, colour = class)) + geom_point(). The resulting plot is a scatter plot with displ on the x axis and fwy on the y axis, showing different colored points representing different classes of vehicles from the class factor.](https://miro.medium.com/v2/resize:fit:1400/1*7bZITs9PxXYWwqgDWEniJg.png)
Thanks to the scaffolding in place in the IRdisplay and repr packages, Xeus-R is also able to emit richer displays through mime bundles.
![Screenshot of a Jupyter notebook with 2 cells with R code. The first cell [16] contains the command display(1:10). The output shows a rich representation of 1:10: the numbers 1 to 10 separated by dots. The second cell [17] also uses the display function to create a rich display of the first 6 rows of the mtcars data frame: display(head(mtcars)). The result presents the data frame as a well formatted table display with alternating shading for rows to improve readability.](https://miro.medium.com/v2/resize:fit:1400/1*-T33jRshu16eWh96_OVuvA.png)
In contrast with IRkernel, the rich displays need to be explicitly requested with the display() function. There are cases however, such as HTML widgets, where automatic rich display makes the most sense because a text/plain representation is not valuable.
![Screenshot of a Jupyter notebook cell [24] showing R code that uses packages htmltools and plotly to create an HTML widget with 2 plotly-powered histograms. The result first shows information messages about conflicts, then shows two typical plotly-powered histograms. The top histogram shows a selection, indicating that the display is about to be zoomed in a smaller value range, to show that the HTML widget can be interacted with.](https://miro.medium.com/v2/resize:fit:700/1*5QOitnpbBdDNpQ9ERIILpg.png)
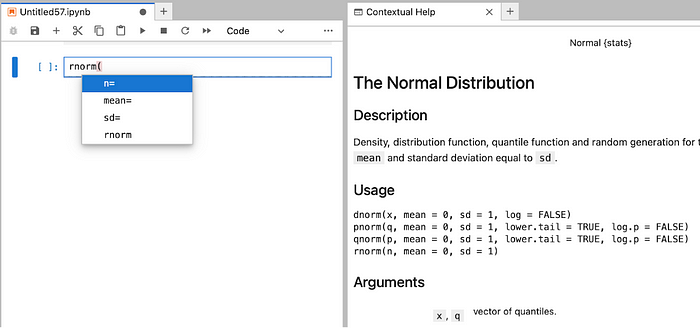
Xeus-R also supports contextual help and includes a basic completion system, based on the internal utils::.getTokenFromLine() system.
Installation and Getting Started
At the time of writing this article, Xeus-R is only available and tested to work on Unix-based systems. We consciously decided to focus initial efforts on features rather than platform comprehensiveness, but we should be able to fix this soon enough.
The easiest way to get up and running with Xeus-R is to install it from conda-forge:
mamba install xeus-rInstructions to build from source are available in the github repository for Xeus-R: https://github.com/jupyter-xeus/xeus-r
Looking ahead: JupyterLite Integration
Another benefit of a Xeus-based approach is that it has been designed in a way that supports in-browser experience to power JupyterLite. Together with the recent developments around WebR, we can envision R becoming a first-class citizen in the JupyterLite world.
This is an exciting vision and will serve as our North Star ⭐️ for future developments of Xeus-R.
Conclusion
Join us in welcoming Xeus-R, a Jupyter kernel for R that leverages the robust foundation of Xeus architecture. R is a language of paramount importance for Data Science and Scientific Computing and it rightfully deserves its place as a first-class citizen within the Jupyter ecosystem.
We firmly believe that Xeus-R has the potential to become a reference implementation for an R kernel, well positioned to tackle the challenges of the ever-evolving landscape of in-browser Scientific Computing, a promising future led by the JupyterLite and WebR projects.
Acknowledgements
The work by Romain François on Xeus-R was funded by QuantStack.
Author Bio
Romain François is a prominent figure in the R community, recognised for his longstanding contributions to R programming and Data Analysis. With a profound passion for open-source software and commitment to advancing the capabilities of R, he has earned a well-deserved reputation as a respected expert.
Romain’s expertise encompasses a wide spectrum of R-related fields, including package development, data manipulation, and interoperability with other programming languages. He is widely recognized for his work on packages like dplyr, which has become a cornerstone for efficient data manipulation in R, and for his contributions to Rcpp, a library that bridges the power of C++ with R for optimizing R packages and enhancing performance.
