Real-time collaboration and collaborative editing for GIS workflows with Jupyter and QGIS

The QGIS open-source project is a cornerstone in the geosciences ecosystem, providing robust tools for spatial data analysis and visualisation. While QGIS excels in empowering researchers and engineers, the evolving landscape of geospatial research demands enhanced collaboration and accessibility, prompting a shift towards web-based technologies.
Collaboration in Jupyter
Collaboration has long been a key requirement for data science and scientific computing workflows, but Jupyter Notebooks historically lacked built-in real-time collaboration features.
To bridge this gap, the jupyter-collaboration project has focused on integrating multi-user editing capabilities directly into JupyterLab and Jupyter Notebook. This effort builds on foundational work in conflict-free replicated data types (CRDTs), leveraging technologies like Yjs, and required integration into the Notebook document model and WebSocket-based architecture.
This approach did not only enable collaborative editing of notebooks, but also opened the door for collaboration on other editing UIs. This was done e.g. in JupyterCAD, a 3D parametric modeler that allows multiple users to collaboratively design and manipulate CAD models within JupyterLab.
Read more about JupyterCAD here https://blog.jupyter.org/announcing-jupytercad-3-0-d8f4b7b0a719
Introducing JupyterGIS
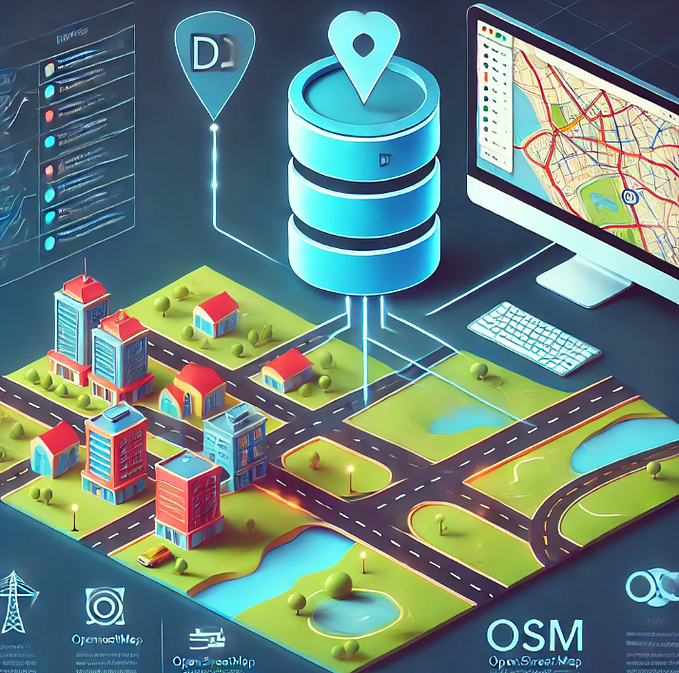
Today, we are excited to announce JupyterGIS, a web-based, collaborative, and extensible interface for GIS, leveraging the JupyterLab application framework and integrating seamlessly with the Jupyter notebook interface.
JupyterGIS provides the following key features:
- a JupyterLab extension for collaborative editing of geospatial data files: with COG, Shapefile, GeoJSON data source support,
- support for importing, exporting and collaborating with QGIS files,
- advanced analysis and editing features with an identify tool and a symbology panel approaching what QGIS provides,
- easily share and deploy GIS projects using JupyterLite.
Note: JupyterGIS is not an official Jupyter subproject.
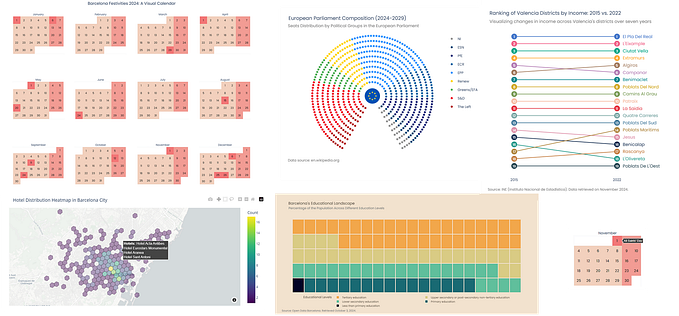
GIS features
Raster and vector layers
JupyterGIS allows you to create multiple types of raster and vector layers, including local or remote GeoTIFFs, GeoJSON, shapefiles, and tile services.
You can select from a set of pre-defined tile services in our gallery, or you can provide your own source.
Identify tool and filtering
Akin to QGIS, we provide an identify tool and filtering capabilities, helping you to inspect your datasource.
Symbology
The symbology of a layer refers to its visual representation on the map, helping you to analyze your data comfortably. JupyterGIS provides a similar feature for its raster and vector layers.
Spatio-temporal data
You can easily animate and analyze your spatio-temporal data.
Python API
Even though you can do most operations from the UI, JupyterGIS also provides a Python API enabling scripting capabilities, which can be used to process data and operate on JupyterGIS documents programmatically from a Jupyter notebook.
Collaborative features
Building upon our previous work to enable collaborative editing in JupyterCAD, we developed a shared document model to support multi-user workflows in JupyterGIS.
Everything is shared between collaborators, from layers data to symbology and filtering rules.
We also provide some collaboration features like the ability to see other collaborators’ cursors, follow collaborators' viewports, add geolocated Google Docs-like comment conversations, and see what layer features collaborators are identifying.
Try it!
You can directly try JupyterGIS in your browser, without installing anything, thanks to JupyterLite:
https://jupytergis.readthedocs.io/en/latest/lite/lab/index.html
Documentation
Check out the Python API reference and tutorials on how to get started in our documentation:
https://jupytergis.readthedocs.io
What’s next?
We are excited to welcome new contributors and see the JupyterGIS community grow. Here are some exciting developments on our radar for the future:
- Support for more data source types.
- Processing tools,
- Support for suggestions by collaborators, similar to the inline suggestions feature of JupyterCAD,
- An improved and more featureful Python API,
- A better coverage of QGIS features.
How can you support our work?
Your support is important, if you would like to help us build more exciting tools around JupyterGIS, do not hesitate to contact us on the public geojupyter Zulip channel!
Additionally, you can join us for the bi-weekly GeoJupyter hackathon on Wednesday https://geojupyter.org/calendar.html
Acknowledgments
This work on JupyterGIS by QuantStack and Simula Research Lab (Simula) was funded by the European Space Agency (ESA) for our proposal “Real-time collaboration and collaborative editing for GIS workflows with Jupyter and QGIS.”
We are also grateful to The Eric and Wendy Schmidt Center for Data Science & Environment (DSE) at UC Berkeley for funding the work of Matt Fisher on the project.
Finally, this wouldn’t have been possible without the foundational work on JupyterCAD initiated by Duc Trung Le.
About the JupyterGIS contributors

Meriem Ben Ismail is a Scientific Software Developer at QuantStack. She just completed her Software Engineering degree at INSAT (National Institute of Applied Sciences and Technology in Tunisia) and her six-month internship as an open-source scientific software engineer at QuantStack.

Nicolas Brichet is a Scientific Software Developer at QuantStack. He holds a master’s degree in robotics from the University of Montpellier. Prior to joining Quantstack, Nicolas worked for almost fourteen years in French research institutes (INRAE and CNRS), as software developer for scientific research. He also worked on different parts of the data lifecycle, such as data acquisition, analysis, and storage.

David Brochart is a Technical Director at QuantStack. David used to work in the semiconductor industry as a digital circuit designer, mostly using FPGAs. He studied telecommunications at the French “Telecom Bretagne” engineering school, with major in digital circuit design. David also worked as a researcher in hydrology at Irstea, a French scientific research institute, where he heavily used the Python scientific stack.

Matt Fisher is a Research Software Engineer and Community Manager at Schmidt Center for Data Science & Environment. Matt is passionate about open science, community-owned software, teaching and learning, accessibility, and inclusion. It is his treasured privilege to support researchers and educators in their missions by working on projects like QGreenland and JupyterGIS!

Anne Fouilloux, a Senior Research Engineer, specializes in Open Science, FAIR data, and Big Data analytics. With a PhD in Atmospheric Physics, she has contributed to Pangeo and EOSC (European Open Science Cloud), focusing on data management, Earth system modeling, and scalable computing. A strong advocate for Open Science, she advances data accessibility and interoperability to drive scientific innovation.

Greg Mooney is a Scientific Computing Developer at QuantStack. He received a Bachelors degree in Software Engineering from Arizona State University (ASU). Before joining QuantStack, he worked as an Aegis Computer Network Technician, working on the network infrastructure connecting various sensor systems onboard naval vessels.

Martin Renou is a Technical Director at QuantStack and a maintainer of Project Jupyter. Among other projects Martin is a core team member of the ipywidgets project and maintains many Jupyter widget packages such as ipyleaflet, ipydatagrid, ipygany, ipycanvas, and bqplot. He is a co-creator of the Voilà dashboarding system, and the xeus-python kernel.

Arjun Verma is a Scientific Software Development Intern at QuantStack. He is also a final year undergraduate student at Cluster Innovation Centre, University of Delhi. He loves 3D & GIS and also contributes to JupyterCAD and is one of the maintainers of PyBaMM where he has also been GSoC contributor and mentor.