Interactive GIS in Jupyter with ipyleaflet
As Jupyter grew in popularity, a broad ecosystem of visualization packages based on Jupyter widgets has been developed, bringing even more interactivity to the Jupyter world.
In this article, we dive into Jupyter Interactive Widgets and the ipyleaflet package, an interactive maps visualization system for Jupyter.

Jupyter Widgets
Jupyter Interactive Widgets are “special objects” that can be instantiated by the user in their code and result in a counterpart component being created in the front-end.
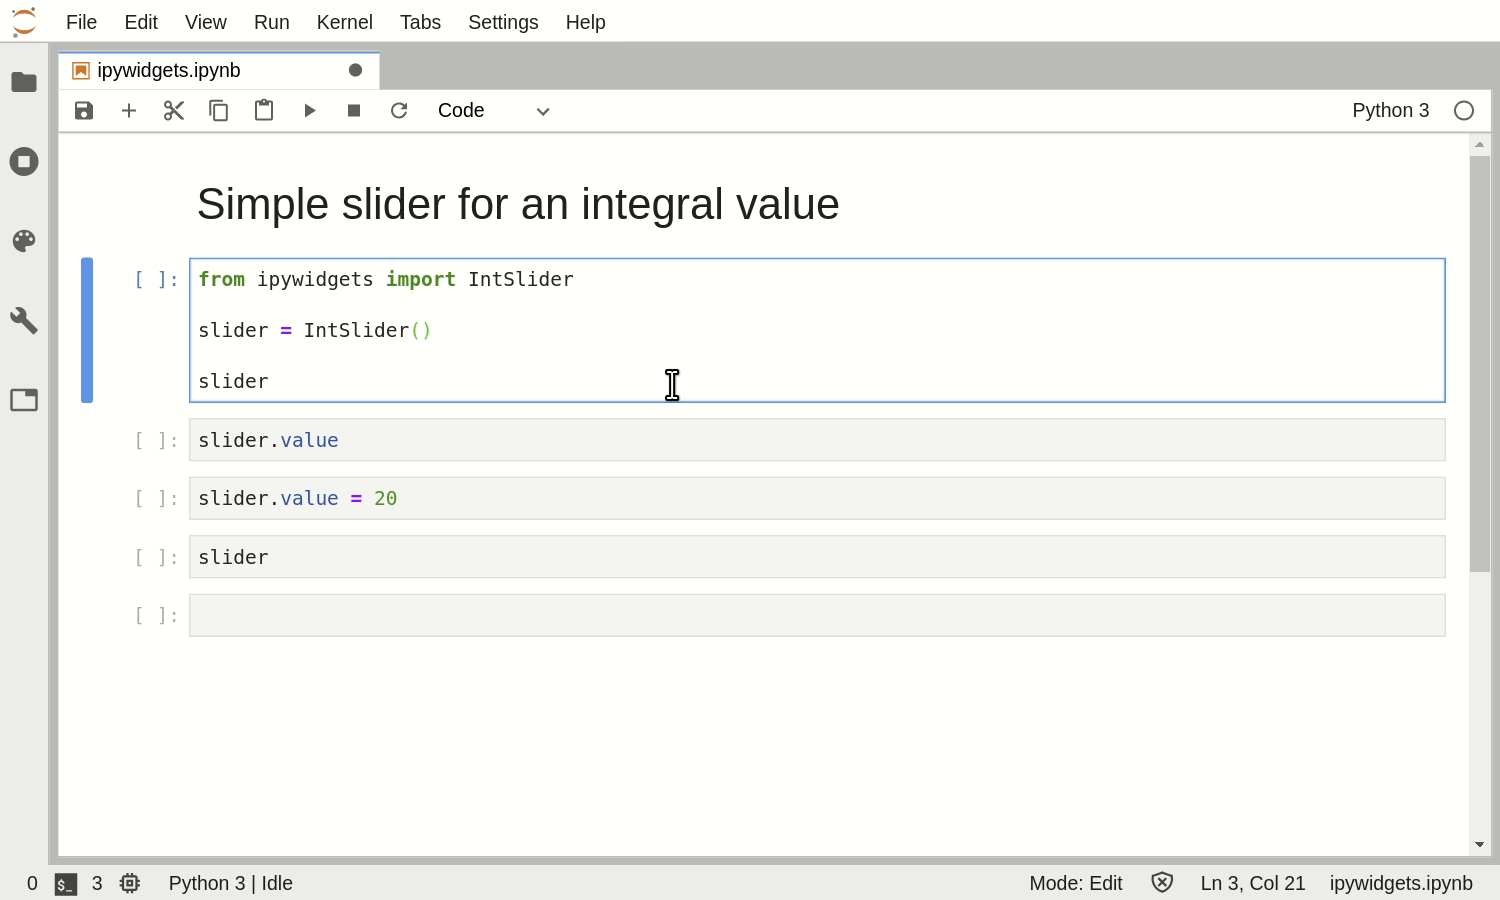
The core ipywidgets package provides a collection of controls that Jupyter users can use to build simple UIs as part of their notebooks (sliders, buttons, dropdowns, layout components).
More than a collection of controls, it provides a framework upon which a large ecosystem of components has been built, allowing notebook authors to capture user inputs in very diverse ways.
Popular libraries built upon interactive widgets include
- bqplot, a 2-D plotting system for Jupyter,
- ipyvolume, a 3-D plotting package based on WebGL and ThreeJS,
- PythreeJS, a 3-D scene description package exposing a large part of the ThreeJS API to Jupyter,
- ipyvuetify, a large collection of VuetifyJS components exposed to Jupyter,
- ipywebrtc, a library exposing the features of the WebRTC protocol to Jupyter kernels,
- beakerx, a collection of widgets, extensions, and kernels for Jupyter,
and many more… This list is not comprehensive and dozens of other widget packages have been developed.
Key aspects of Jupyter widgets include:
- Bidirectionality
Widgets are not just meant for display but can also be used to capture user inputs, which can then trigger new computation. Notebook authors can compose sophisticated applications including a variety of components from different packages. - Language Agnosticism
Built upon the Jupyter ecosystem, the interactive widget protocol used for the synchronization between the kernel and the front-end is well-specified and can be implemented for any kernel.
Back-ends for other languages than Python already exist, such as for C++ (with the xeus-cling Jupyter kernel), and languages of the JVM such as Clojure or Groovy (with the beakerx kernels). - Extensibility
Jupyter widgets are not meant as a monolithic system with one and only one way to achieve a specific task. We strive to provide a foundational layer allowing third-party widget authors to be as inventive as possible.
A common pattern for Jupyter widget packages has been to bring the capabilities of popular JavaScript visualization frameworks to Jupyter with a bridge based on ipywidgets. This is the case for the ipyleaflet package, as well as pythreejs and ipyvuetify.
Another use case is the development of ad hoc controls that are not necessarily relevant for a mainstream visualization package, but may be specific to a scientific field. An example is the ipymesh project by Chris Kees which can be used to draw PSLG (planar straight-line graphs) in the Jupyter notebook.
ipyleaflet
ipyleaflet is a Jupyter - LeafletJS bridge, bringing mapping capabilities to the notebook and JupyterLab.
Built as a bridge between the LeafletJS package and Jupyter, the ipyleaflet API maps to that of LeafletJS, bringing most of the core features of the package to Jupyter, and enabling a few popular LeafletJS extensions. A small difference is that following the Python coding style, ipyleaflet makes use of snake_case instead of CamelCase for attribute names.
ipyleaflet features
The main components to the library are layers and controls, respectively items to be displayed on the map, and interactive widgets overlayed on the map area for greater interactivity.
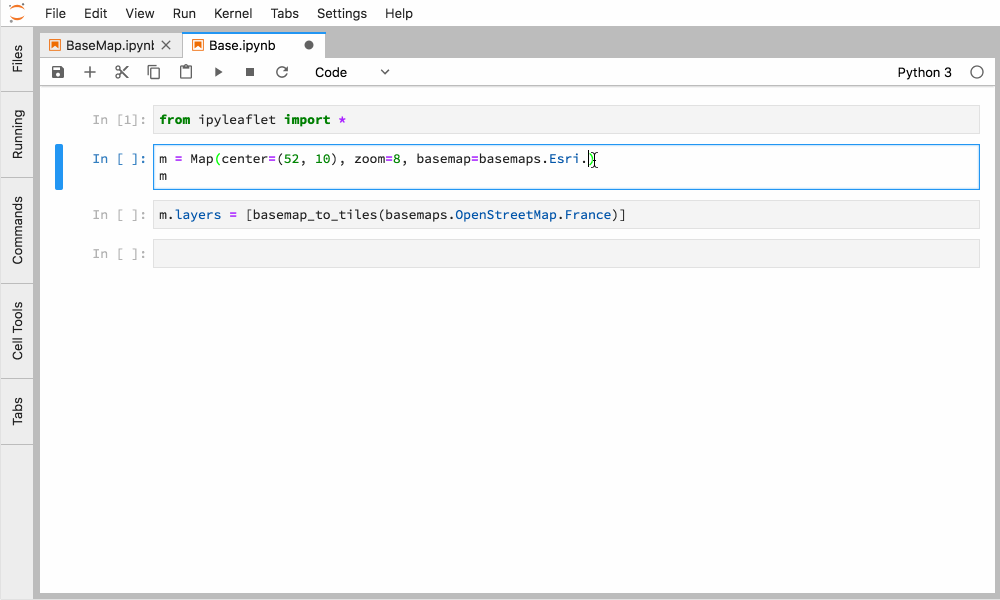
The first thing for which you may want to change the default value are the zoom level, the position, or the base layer for the map.
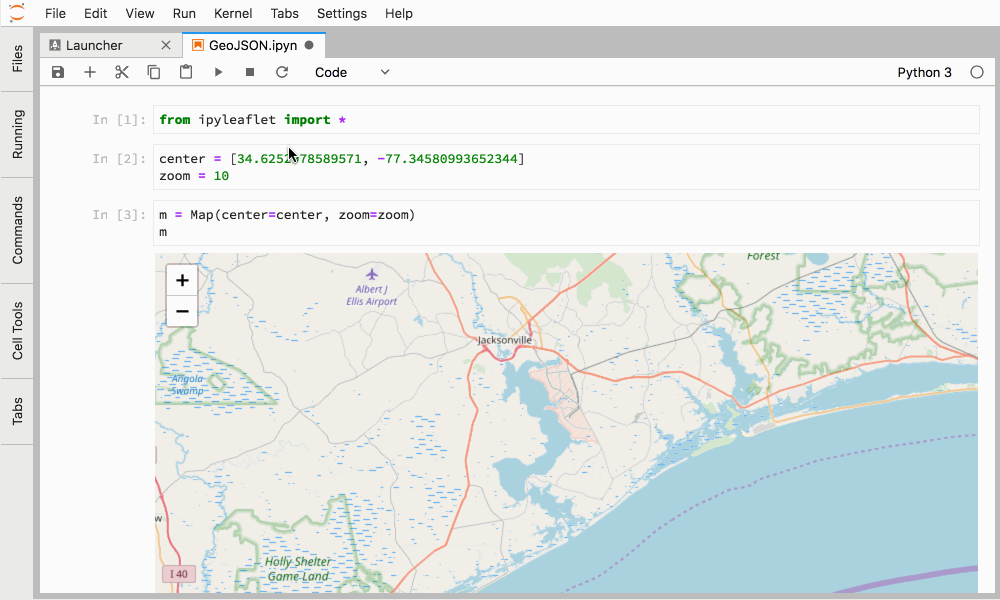
Maps can be interactively edited in the Jupyter notebook, by dynamically changing or adding layers. In this screenshot, we add a custom layer including a GeoJSON dataset.
Note: An alternative layer to GeoJSON is GeoData, which lets the user load the data in the form of a GeoPandas dataframe instead of raw GeoJSON.
A number of simple primitives are available such as markers and heatmaps. In the following screencast, we show how primitive properties can be linked with other widgets, and used as means to take user input on a map:

The splitmap control can be used to compare to different set of ipyleaflet layers at the same location.

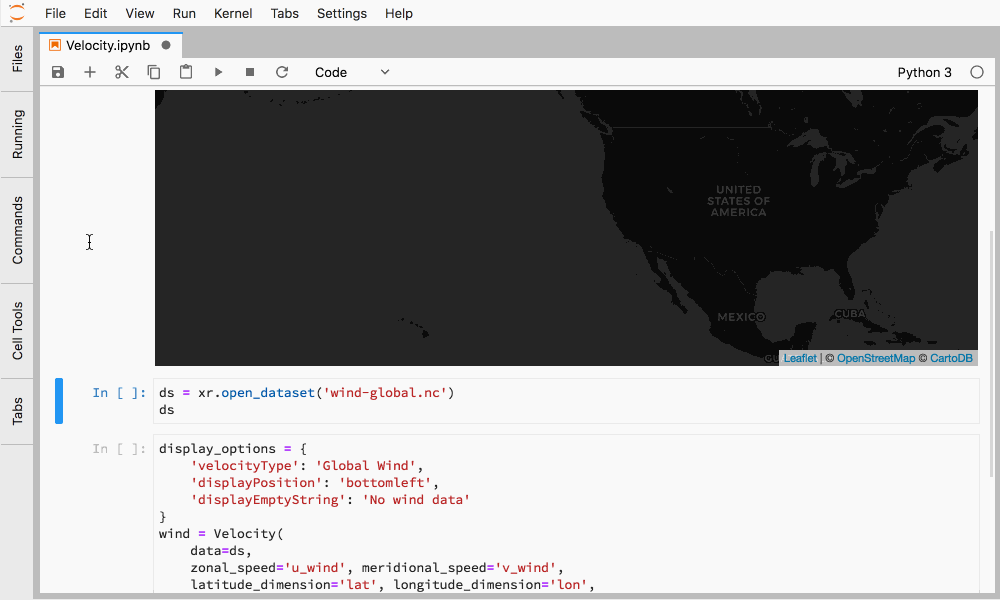
Another interesting layer is the velocity layer which can be used to display wind velocity data. This control can take data in the form of an xarray dataset.
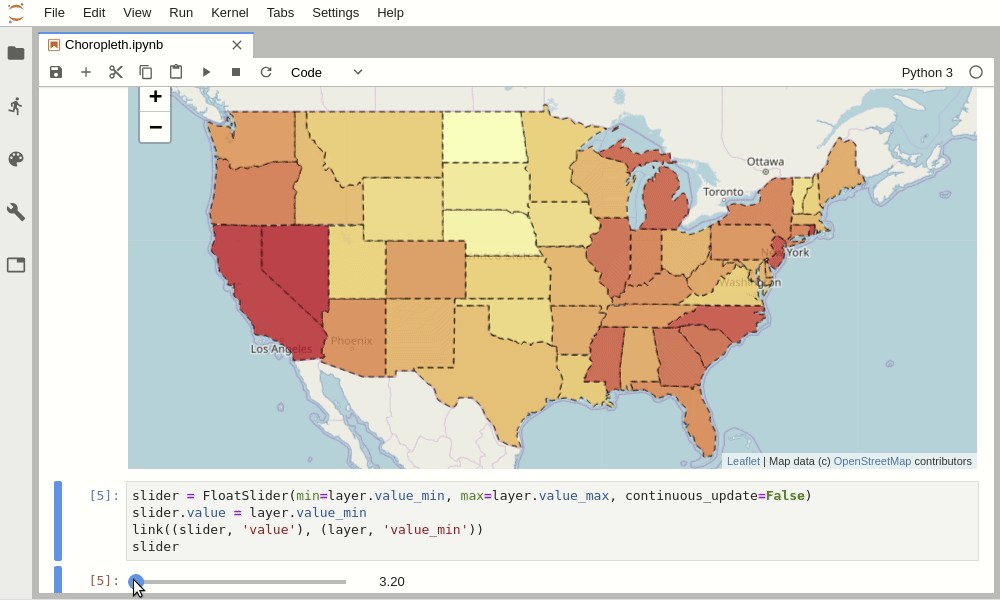
More classical visualization tools are also available, such as choropleths.
JupyterLab Integration with the Sidecar and Theming Support
ipyleaflet is well integrated with JupyterLab
- ipyleaflet controls make use of the JupyterLab themes for coloring so that they don't stand out when using e.g. a dark theme.

- ipyleaflet can be used in combination with the JupyterLab sidecar widget.
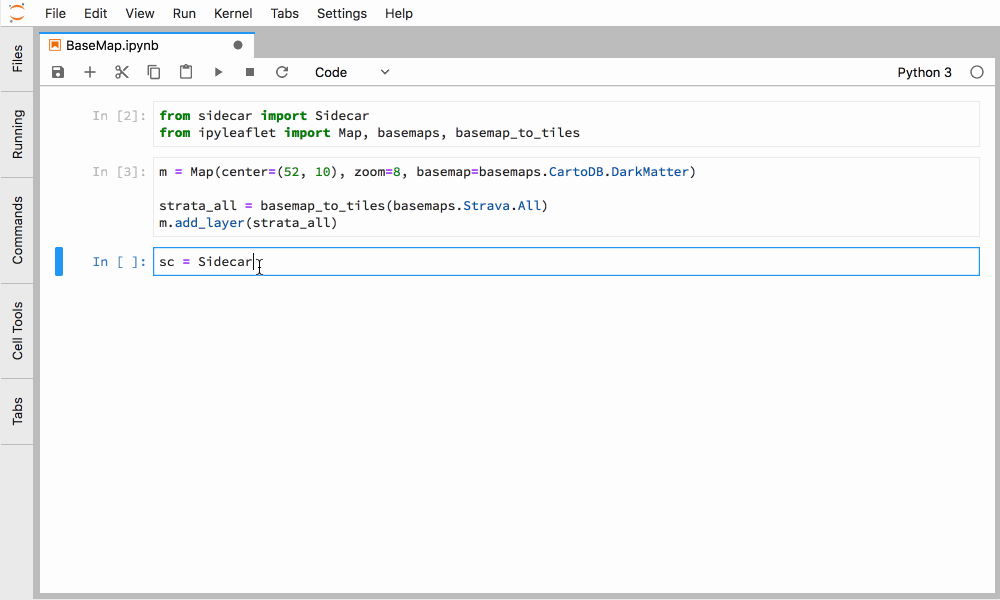
Together with the sidecar, a map can be programmatically added to the right-side toolbar of the JupyterLab application, and interactively edited in the notebook. This prevents the back-and-forth scrolling often required to see how changes are reflected visually.
The workflow enabled by ipyleaflet in combination with the sidecar is similar to that of the geonotebook project by Christopher Kotfila, Jonathan Beezley, and Dan LaManna from Kitware).

A more advanced example
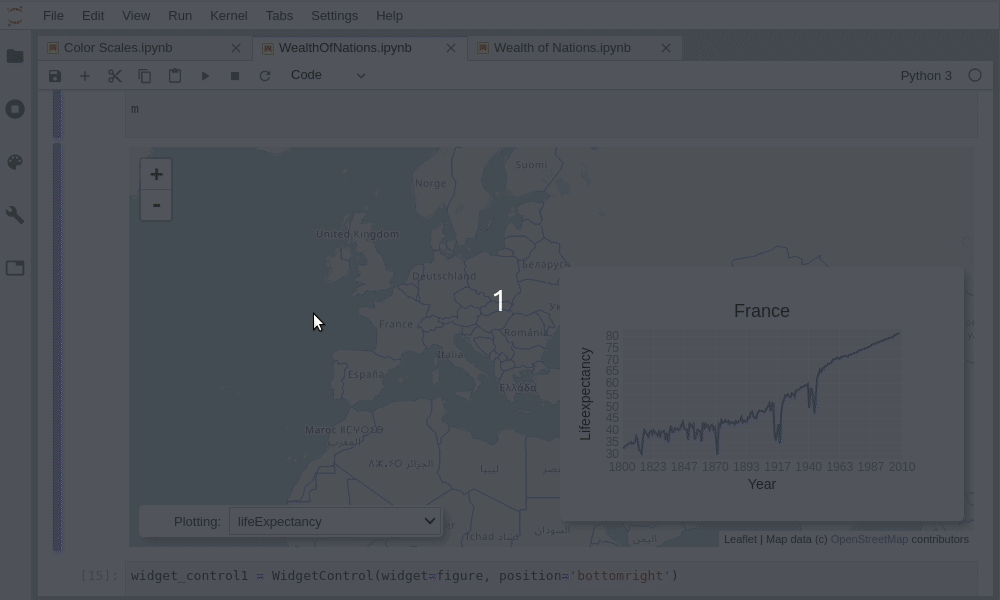
Combined with other widget libraries such as bqplot or the core ipywidget package, ipyleaflet users can easily compose more complex applications and dashboards. In the following screencast, we explore the wealth-of-nations dataset with a leafletmap, a bqplot line chart and a dropdown widget:
Trying ipyleaflet online with mybinder
If you would like to try out ipyleaflet now, it is possible thanks to the binder project. Just click on the image below!

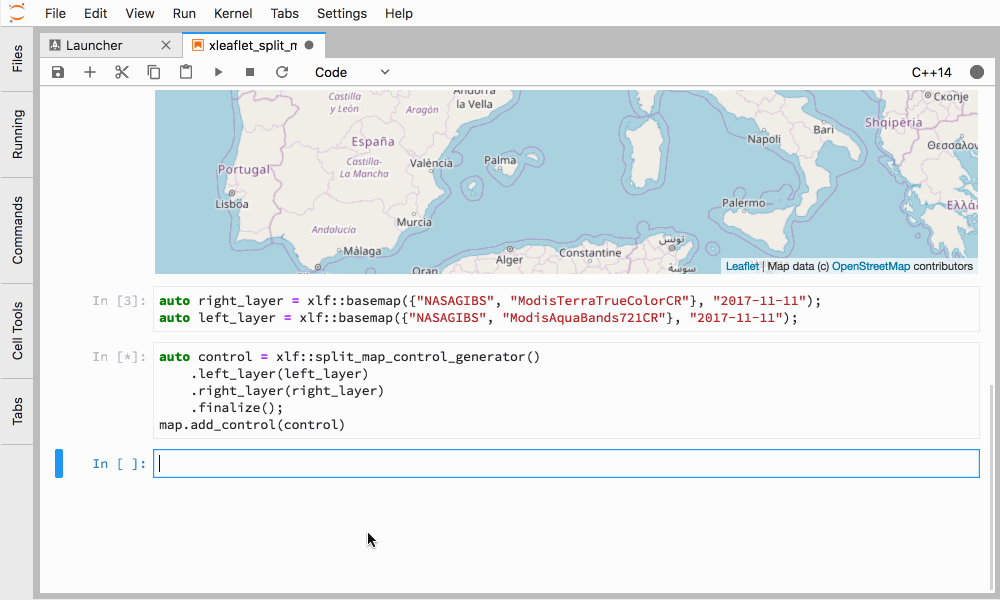
Interactive GIS in C++: xleaflet
As mentioned earlier, interactive widgets back-ends for other programming languages have be implemented. There is a C++ back-end for ipywidgets: xwidgets which is the building block for creating other C++ widgets back-ends.

xleaflet is the C++ - LeafletJS bridge that exposes almost the same API as ipyleaflet, only that you use it from a C++ interpreter! It is based upon xwidgets which brings the bidirectional communication with the front-end.
You can learn more about the xeus-cling Jupyter kernel, xwidgets and xleaflet by reading the following blogpost.
Deploying ipyleaflet-based dashboards with Voilà

Voilà is a tool that turns Jupyter notebooks into standalone dashboards. Built upon the Jupyter stack, it inherits the language agnosticism of the ecosystem, and can be used to produce standalone applications based on ipyleaflet.
A companion project to Voilà is the Voilà gallery project, a public facing set up of JupyterHub serving Voilà dashboard. It is kindly hosted by OVH. You can check out the Voilà gallery at URL https://voila-gallery.org.
For more resources about voilà, check out
- the original announcement of the project: And Voilà!
- and for the gallery: A Gallery of Voilà Examples.
If you check out the Voilà gallery, don't miss Jeremy Tuloup's GPX loader demo!
Jupyter for Geo Sciences
Jupyter's adoption is exploding in the GeoScience space. Notable projects building upon Jupyter include
- JEODPP (JRC Earth Observation Data and Processing Platform) is a EU project providing petabyte scale storage and high-throughput computing capacities to facilitate large scale analysis of Earth Observation data. The main front-end to the platform is base on Jupyter. The mapping capability is based on ipyleaflet. End users can request custom visualization that are returned to them in the form of lazily computed tile layers.
- Pangeo is a community platform providing open, reproducible, and scalable sciences. The Pangeo software ecosystem involves open source tools such as xarray, Iris, Dask, Jupyter, and many other packages.
- It was recently announced that the NSF would be funding the UC Berkeley + NCAR "EarthCube" proposal "Jupyter meets the Earth: Enabling discovery in geoscience through interactive computing at scale". The plan involves the development of interactive dashboards with Voilà and contributions to the Voilà codebase.
Related Projects
Jupyter-gmaps
We should mention the jupyter-gmaps project by Pascal Bugnion. Jupyter-gmaps is a bridge between Google maps and Jupyter. Just like ipyleaflet, jupyter-gmaps is built upon the jupyter interactive widgets framework but relies on Google maps for the display instead of LeafletJS library.
This is a high-quality widget by another core developer of ipywidgets. Pascal is also one of the people behind Voilà and the Voilà gallery.
Folium
The Folium project enables maps visualization in the Jupyter notebook. Just like ipyleaflet, it is based on LeafletJS. Folium was created by Rob Story and is now maintained by Frank Conengmo and Filipe Fernandes.
A key difference between Folium and ipyleaflet is that ipyleaflet is built upon ipywidgets and allows bidirectional communication between the front-end and the backend enabling the use of the map to capture user input, while Folium is meant for displaying static data only. Folium enables many LeafletJS extensions, some of which may not be available in ipyleaflet at the moment.
Acknowledgements
The ipyleaflet project was started in 2015 by Brian Granger, and funded by the ERDC. The further development by Sylvain Corlay and Martin Renou was supported by QuantStack.
We are grateful to OVH for kindly hosting the Voilà gallery.
Other key contributors to Voilà and ipyleaflet that should be thanked here are Maarten Breddels, Pascal Bugnion, and Yuvi Panda. We should also mention the recent contributions by Vasavan Thirusittampalam who worked on the full-screen control and better interoperability with geopandas.
About the Authors
Sylvain Corlay, and Martin Renou are Scientific Software Developers at QuantStack.
Sylvain Corlay

Sylvain Corlay is the founder and CEO of QuantStack.
As an Open Source Developer, Sylvain contributes to Project Jupyter in the areas of interactive widgets and language kernels and is a steering committee member of the Project. Beyond QuantStack, Sylvain serves as a member of the board of directors of the NumFOCUS foundation. He also co-organizes the PyData Paris Meetup.
Martin Renou

Martin Renou is a Scientific Software Developer at QuantStack. Prior to joining QuantStack, Martin also worked as a Software developer at Enthought. He studied at the French Aerospace Engineering School ISAE-Supaero, with major in autonomous systems and programming.
As an open source developer, Martin has worked on a variety of projects, such as SciviJS (a JavaScript 3-D mesh visualization library), Xtensor, and Xeus.