
visualization

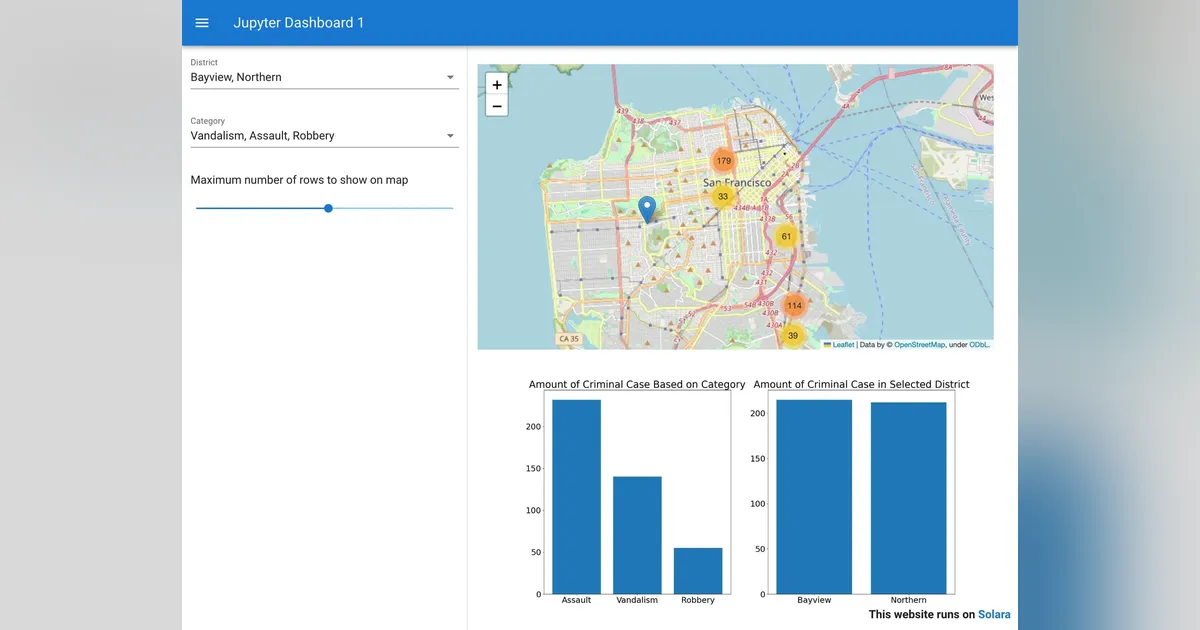
Build your Jupyter dashboard using Solara

Welcome to the first part of a series of articles showing you how to create a dashboard in Jupyter and deploy it as a standalone web app. Importantly, you won’t need to rewrite your app in a different framework for deployment. We will use a pure Python solution with no JavaScript or CSS required.

· Maarten Breddels

dashboards

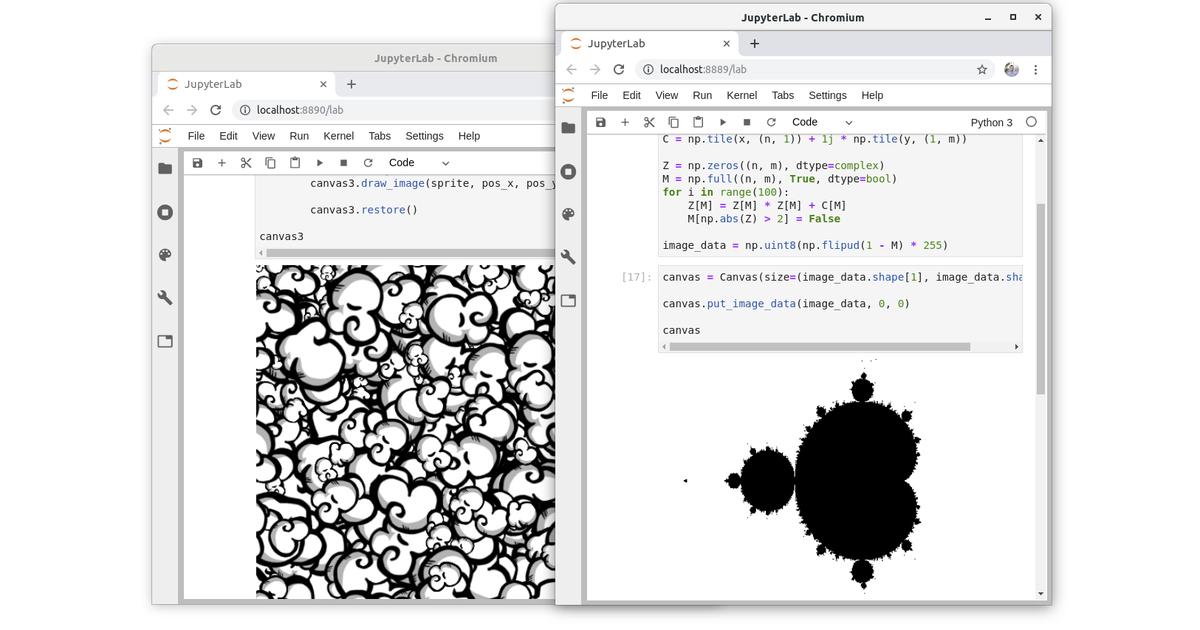
ipycanvas: A Python Canvas for Jupyter

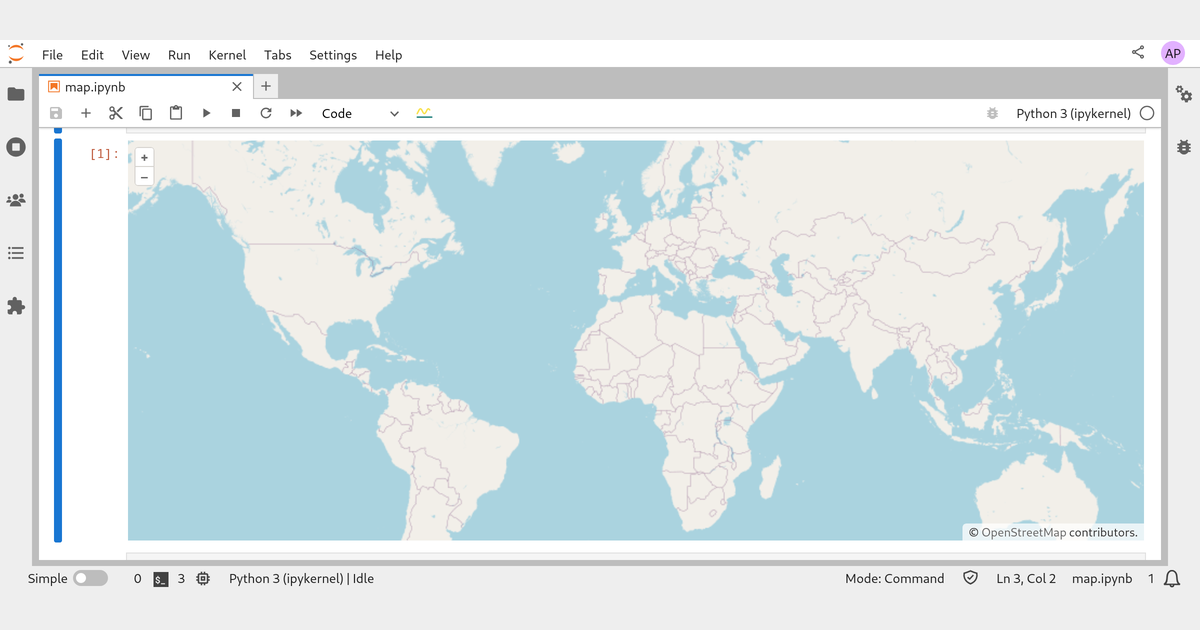
As you may already know, the Jupyter Notebook and JupyterLab are Browser-based applications. Browsers are incredibly powerful, they allow you to swap rich and interactive graphical interfaces containing buttons, sliders, maps, 2D and 3D plots and even video games in your webpages!

· Martin Renou

widgets

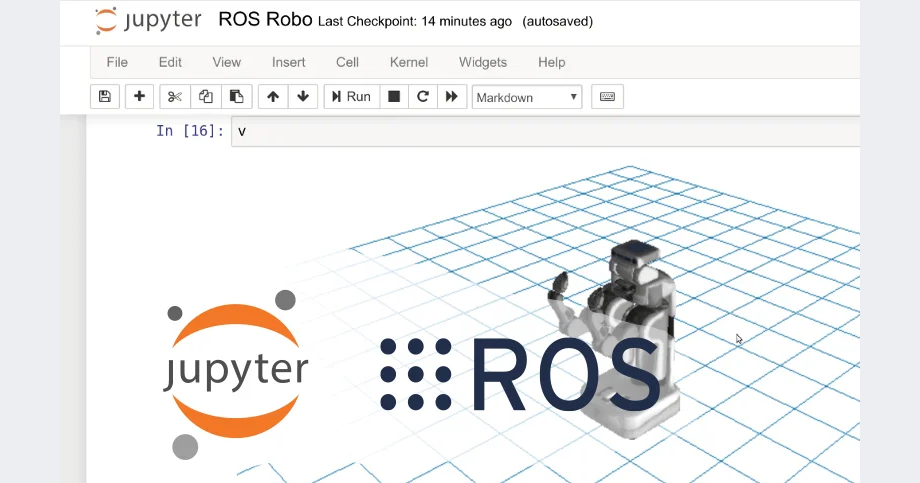
ROS @ Jupyter

Project Jupyter is a huge hit in data science, but it has not yet found widespread adoption in robotics. Today, we are releasing the first version of jupyter-ros, a collection of Jupyter interactive widgets inspired by Qt and RViz, to bring their features to the Jupyter ecosystem.

· Wolf Vollprecht

robotics

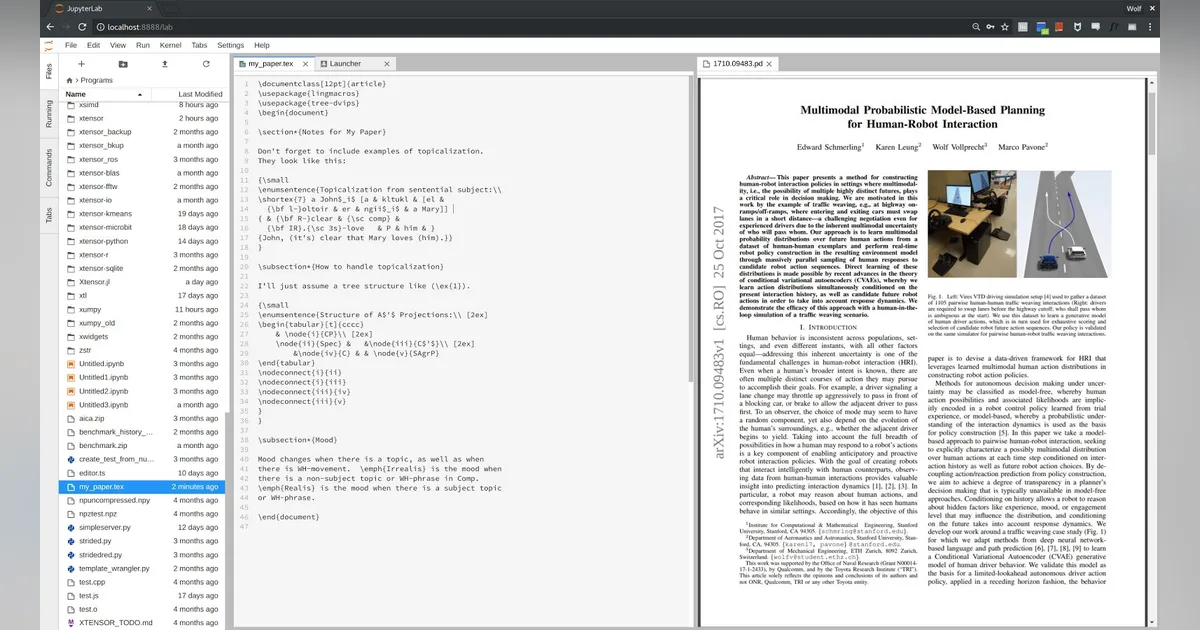
A Diagram Editor for JupyterLab

With the success of the notebook file format as a medium for communicating scientific results, more than an interactive development environment, Jupyter is turning into an interactive scientific authoring environment.

· Wolf Vollprecht

JupyterLab